Are you looking for DAV Maths Solutions for class 7 then you are in right place, we have discussed the solution of the Secondary Mathematics book which is followed in all DAV School. Solutions are given below with proper Explanation please bookmark our website for further updates!! All the Best !!
Chapter 12 Worksheet 4 | Data Handling | Class-7 DAV Secondary Mathematics
Unit 12 Worksheet 4 || Data Handling
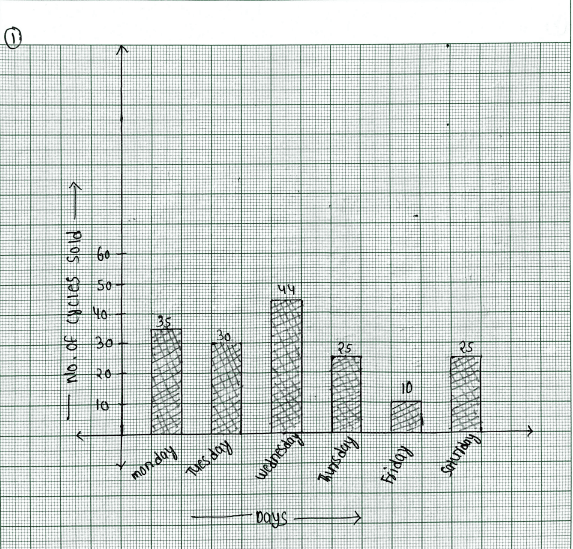
1. A bicycle shop owner sold the following number of bicycles each day in a particular week. Present this information in the form of a bar graph.

Answer 1:
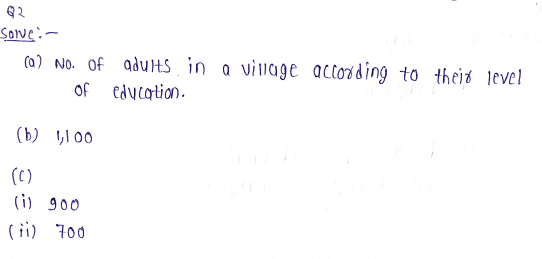
2. The number of adults in a village accord ng to their level of education is given in the bar graph below.
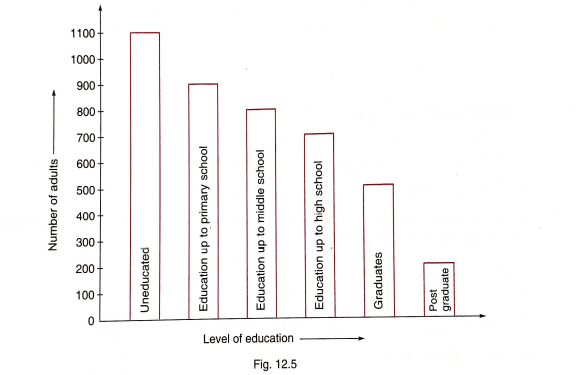
(a) What does the bar graph represent?
(b) How many uneducated adults are there?
(c) How many adults are educated up to (i) Primary Level (ii) High School Level?
Answer 2:
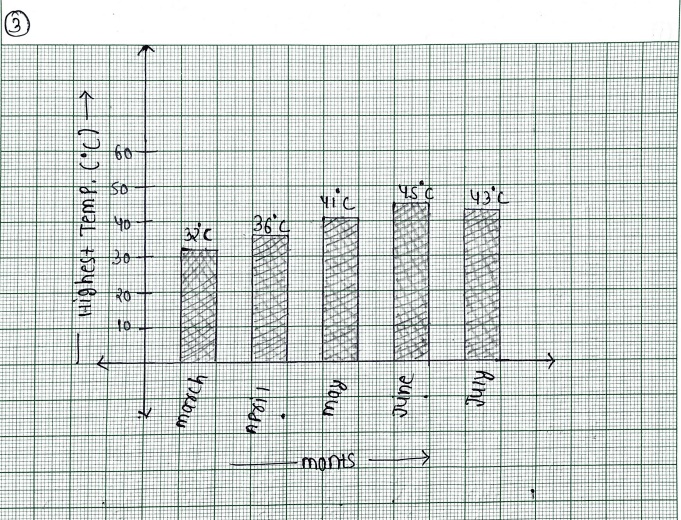
3. Draw bar graph for the following data.

Answer 3:
4. Study the bar graph and answer the questions that follow.
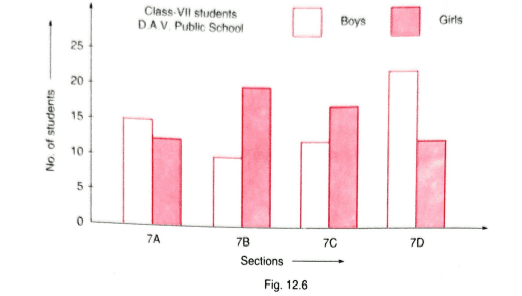
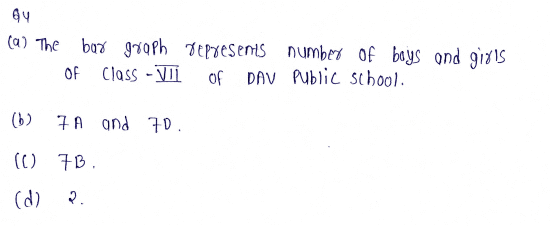
(a) What does the bar graph represent?
(b) In which two sections are the number of girls equal?
(c) Which section has the highest number of girls?
(d) How many sections have more number of girls than boys?
Answer 4:
5. The following data gives the number of Mathematics and Science books purchased by a library during different years.

Answer 5:
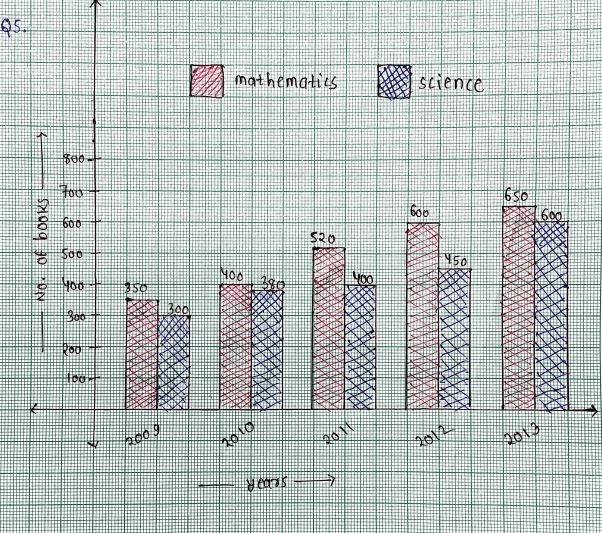
Draw a double bar graph.
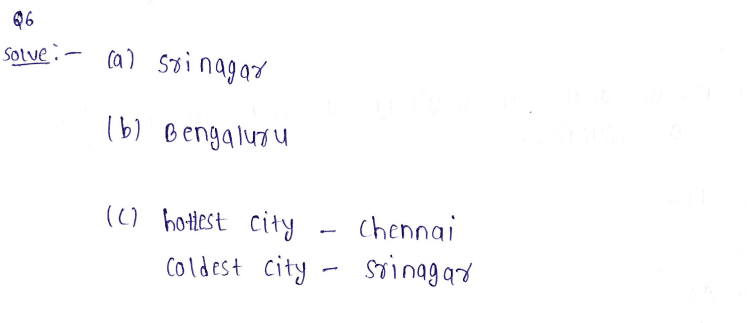
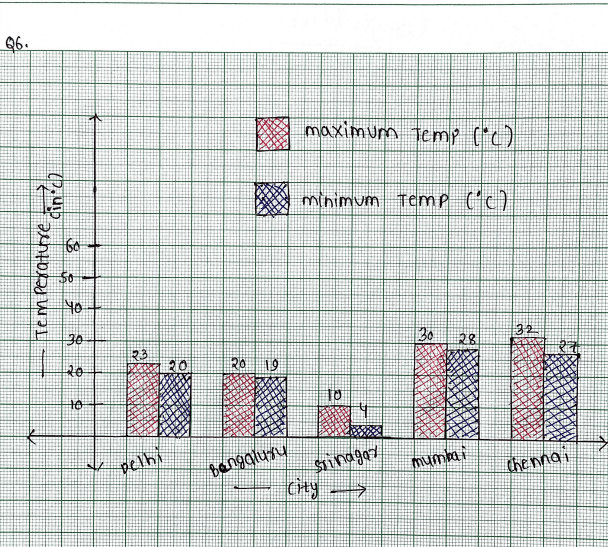
6. The following data gives the maximum and minimum temperature (in °C) of the cities on a particular day. Plot a double bar graph from this data and answer the questions.

(a) Which city shows the maximum difference in days temperature?
(b) Which city shows the minimum difference in days temperature?
(c) Which are the hottest and the coldest cities?
Answer 6:
