Are you looking for DAV Maths Solutions for class 8 then you are in right place, we have discussed the solution of the Secondary Mathematics book which is followed in all DAV School. Solutions are given below with proper Explanation please bookmark our website for further updates!! All the Best !!
Unit 15 Brain Teaser | Statistics and Probability | Class-8 DAV Secondary Mathematics
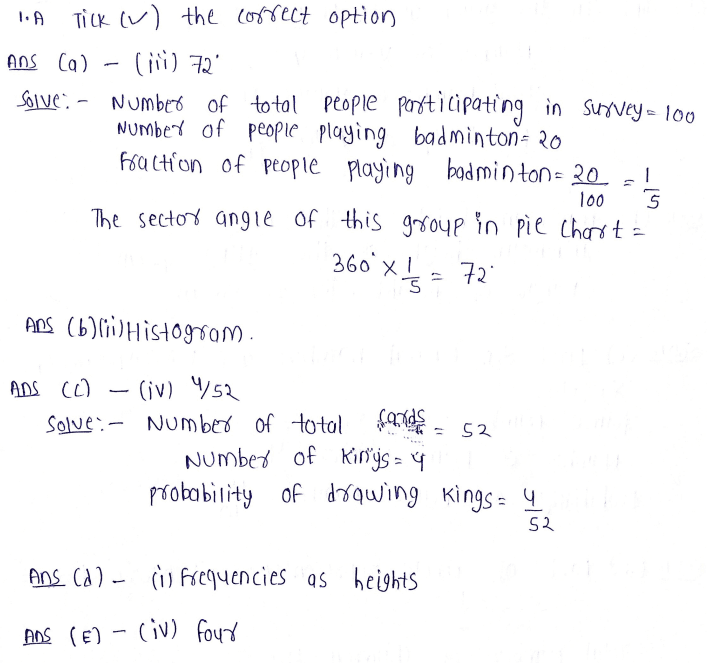
A1. Tick the correct option.
(i) A survey of 100 people found that 20 of them played badminton. In a pie chart, what would be the sector angle of this group?
(a) 20° (b) 36° (c) 72° (d) 200°
(ii) Representing data graphically in the form of rectangles, with no gap between the successive rectangles is called
(a) bar graph (b) histograph (c) pie chart (d) histogram
(iii) What is the probability of getting a king, if a card is drawn out from a pack of 52 cards?
(a) 1/52 (b) 2/52 (c) 3/52 (d) 4/52
(iv) A histogram has
(a) frequencies as heights (b) class intervals as heights
(a) frequencies as bases (d) frequencies as both bases and heights
(v) The possible number of outcomes if the coin is tossed twice are
(a) one (b) two (c) three (d) four
1B. Answer the following questions.
(i) A letter is chosen from the word ‘PROBABILITY’. What is the probability that it is a vowel?

(ii) Heights of 20 saplings is a nursery is noted as (in cm): 80, 79, 102, 90, 124, 111, 87, 88, 103, 72, 126, 125, 88, 98, 96, 127, 128, 74, 80 Find the range of their heights.

(iii) A number is selected at random from the first ten natural numbers. What will be the probability of the number being prime?

(iv) A survey was conducted to find out the type of story books ready by a group of 180 children. The data was represented as a pie chart given below.
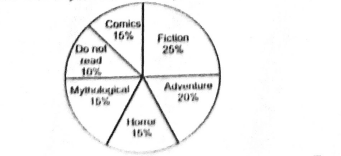
Find the number of children who read adventure books.
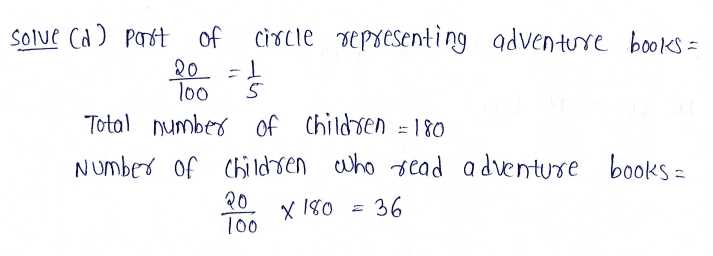
(v) From the above pie chart, what fraction of children do not read story books at all?
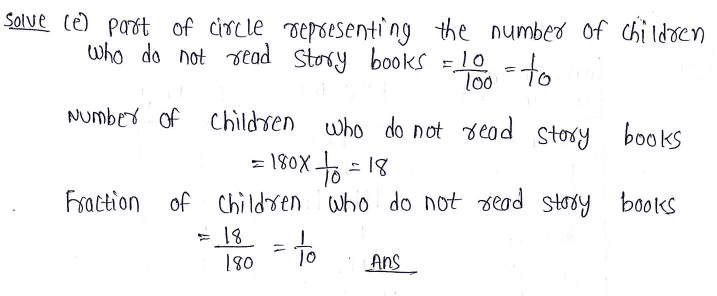
Q2. Read the given histogram and answer the questions that follow:
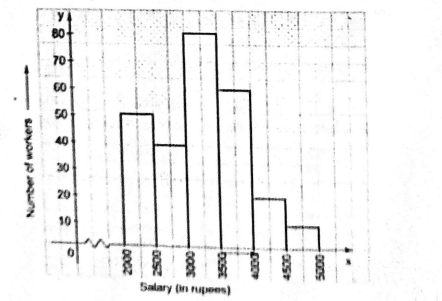
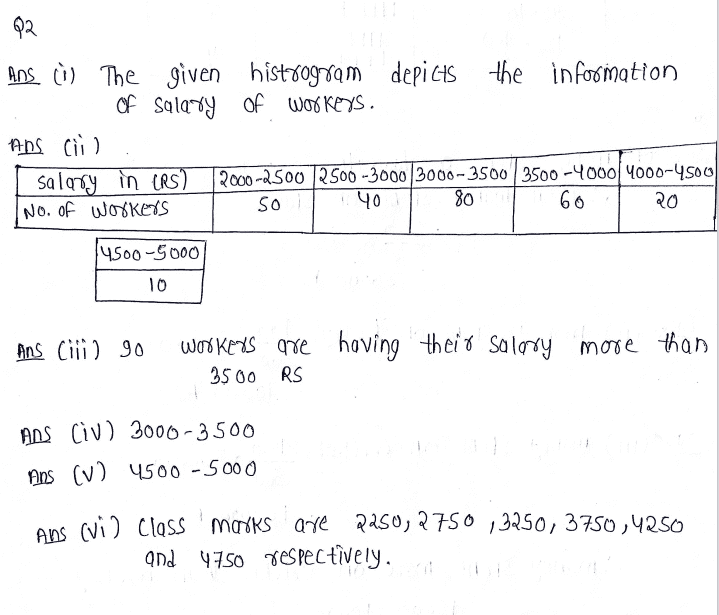
(i) What information is depicted by the above histogram?
(ii) prepare a grouped frequency table for the histogram.
(iii) Find the number of workers having salaries more than Rs. 3,500.
(iv) In which group is the number of workers maximum?
(v) In which group is the number of workers minimum?
(vi) What are the class marks all the class intervals?
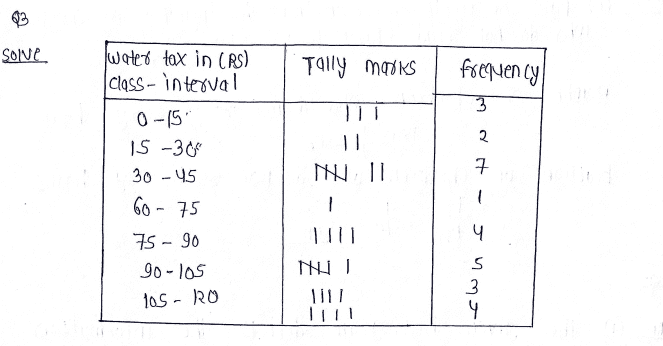
Q3. The water bill of 30 houses is a locality are given below. Constuct a grouped frequency distribution with class size 15.

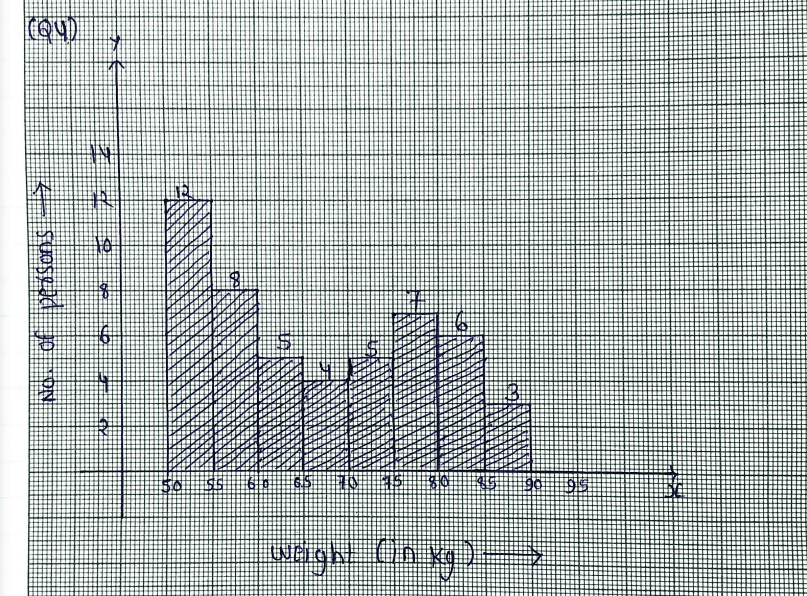
Q4. The following is the distribution of weights (in kg) of 50 persons:

Draw a histogram for the above data.
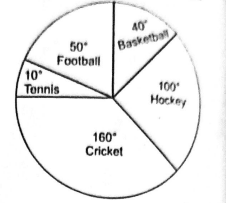
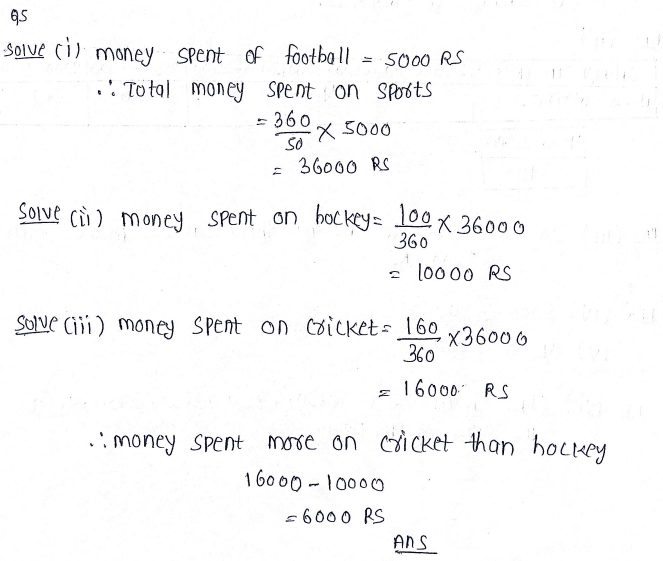
Q5. The given pie chart represents the amount spent on different sports by a school administration in a year. If the total money spent on football is Rs. 5000, answer the following questions.
(i) What is the amount spent on sports?
(ii) How much money is spent on hockey?
(iii) How much more money is spent on cricket than hockey?
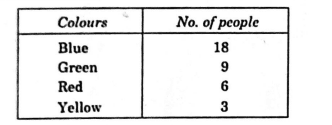
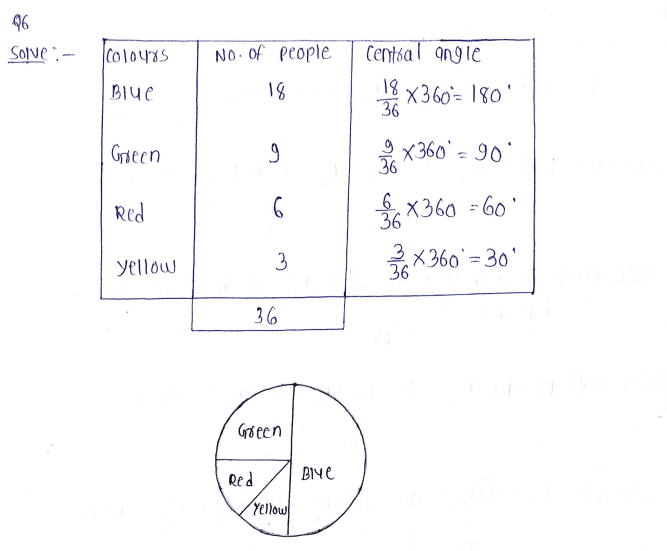
Q6. The following table shows the colours preferred by a group of people. Draw a pie chart showing the information.
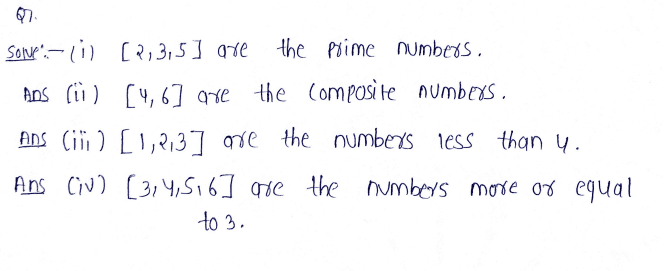
Q7. When a die is thrown, list the outcomes of an event of getting
(i) prime number (ii) a composite number
(iii) a number less than 4 (iv) a number more than or equal to 3.
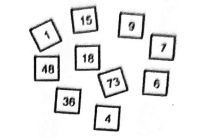
Q8. The following numbers were written in separate slips and mixed in a bag. You are asked to pick a slip. What is the probability of getting:
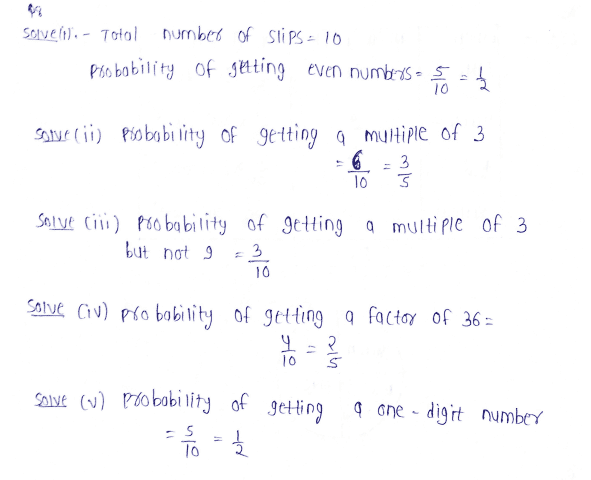
(i) an even number? (ii) a multiple of 3?
(iii) a multiple of 3 but not 9? (iv) a factor of 36?
(v) a one-digit number?
This site is very helpful to me.very very thanks to you